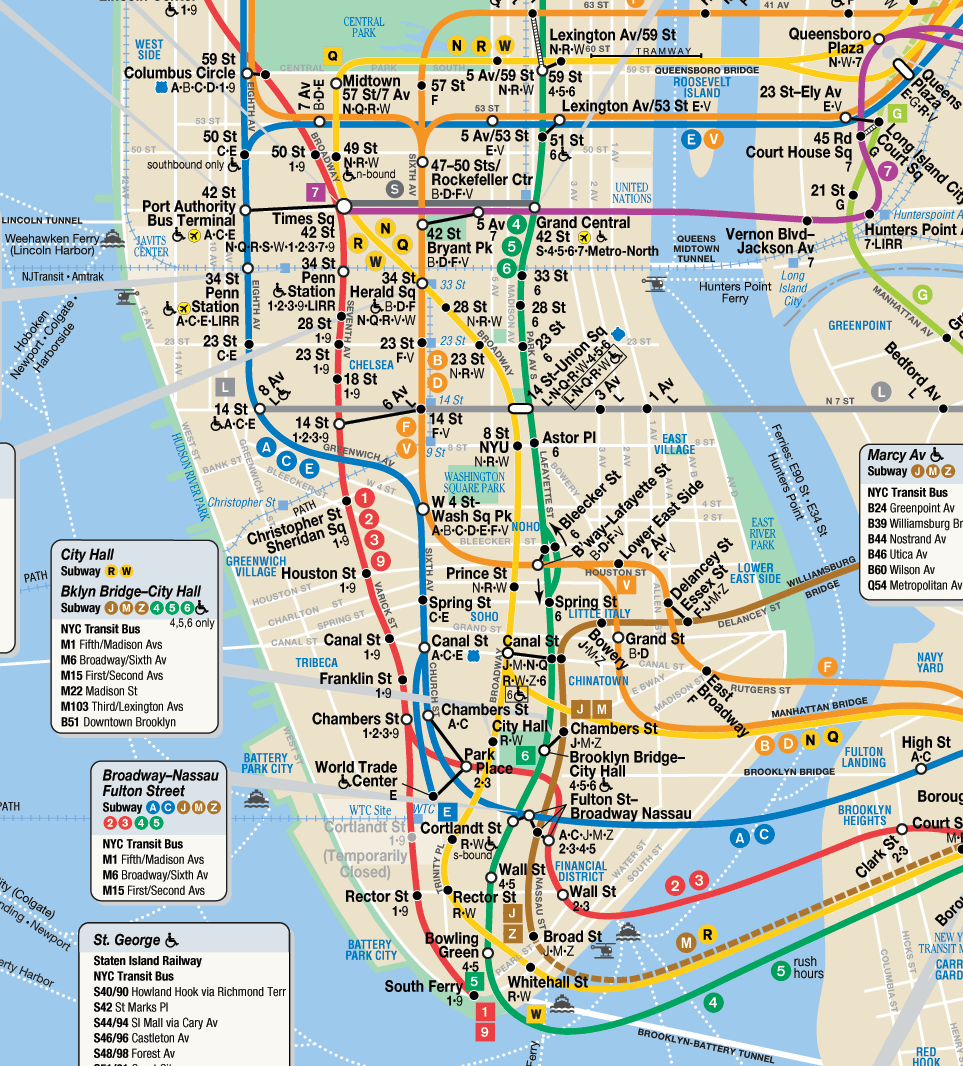
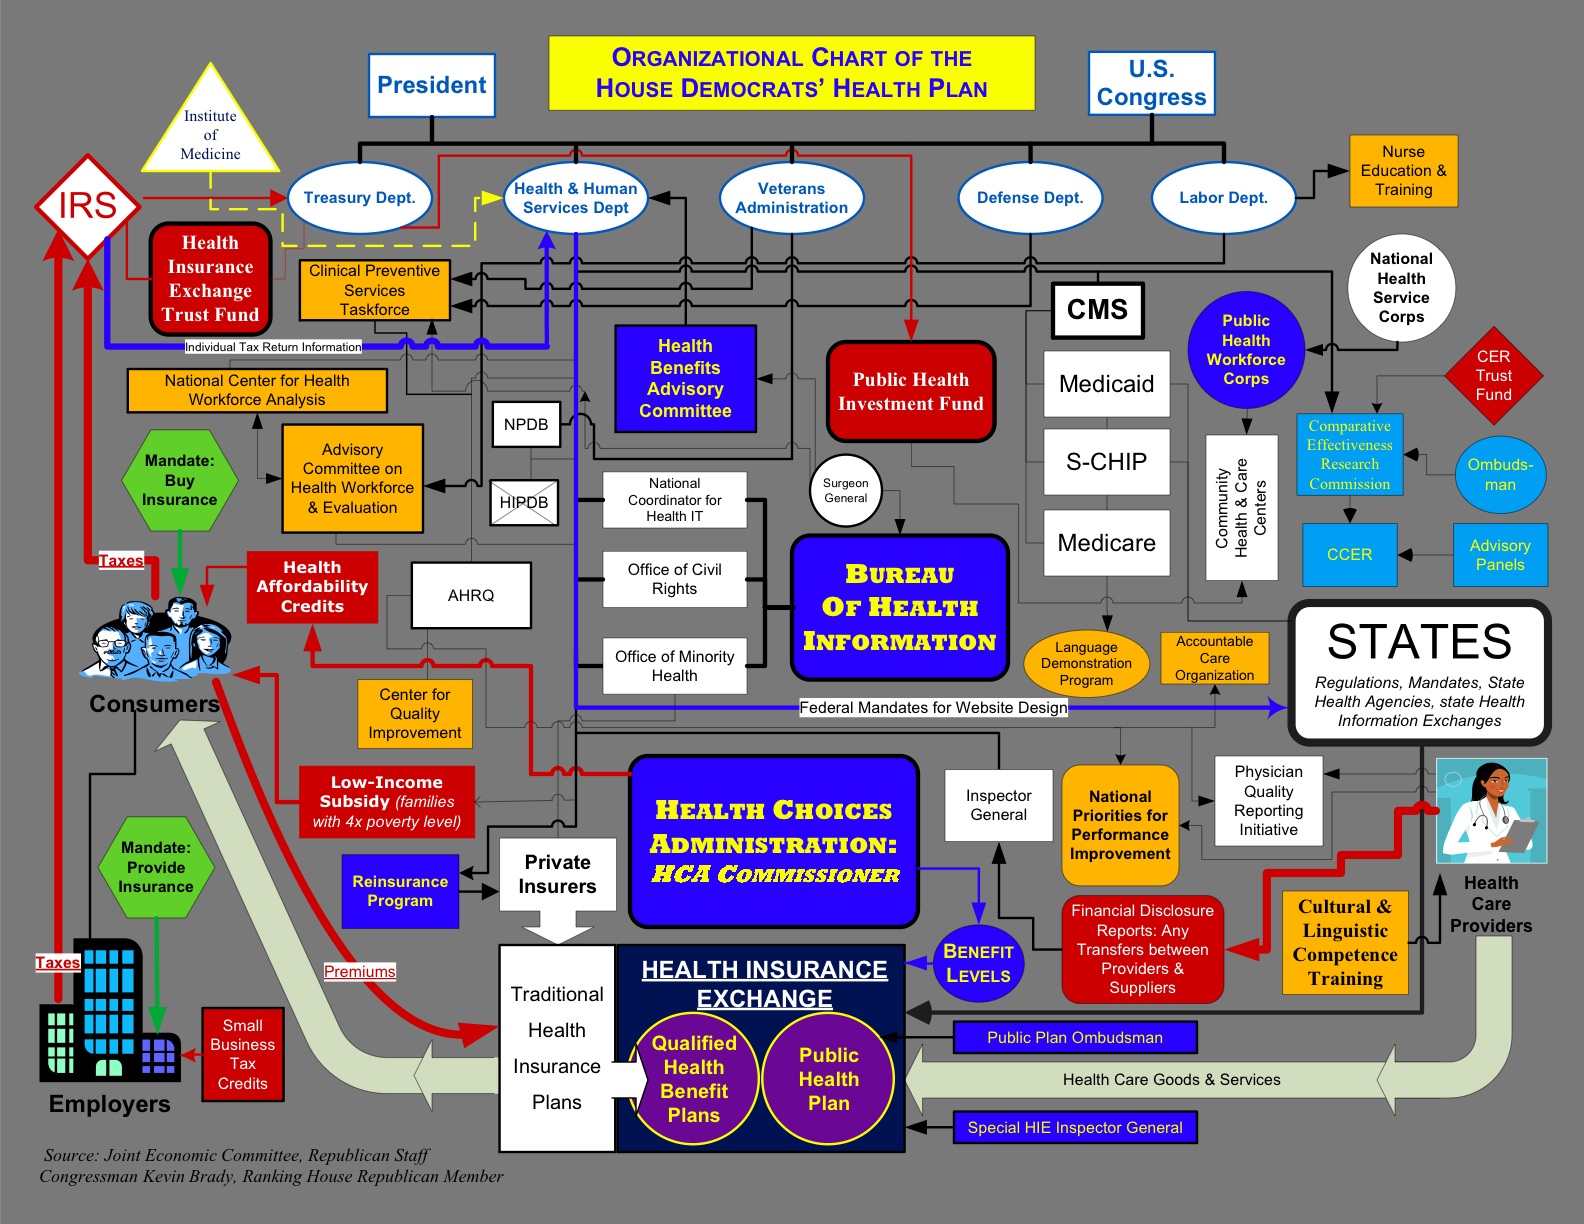
1st Image: Manhattan Subway Map - Infographic

Visual Techniques: Balance, Contrast, Predictability, Consistency, Accuracy, Flatness, Sequentiality
2nd Image: Symbolic map of the US - Infographic
 Visual Techniques: Flatness, Accuracy, Consistency, Activeness, Unity, Balance, Contrast, Sequentiality
After comparing these two info graphics, it was interesting to see how they use some of the same techniques, but also use some different ones. What also made it cool is that they are both maps, but used in very different ways and in opposite scales. They both show consistency, balance, contrast, accuracy, flatness, and sequentiality. These are all things maps should require, except for maybe flatness. Since both are getting across information about a specific place, it is important that they are both accurate. They also both show consistency, balance, and contrast, by their use of colors and placement of text and imagery. Unlike the 1st image, the 2nd image shows activeness with the waves draw into the water, as well as some of the animal symbols on the map.

